Database Design Project
View this Dashboard on Tableau Public

Project Overview
Greenspot Grocer, a fictional online grocery store, is looking to expand its business, which will require a database to manage the large volume of data it will collect from customers, vendors and for inventory management. The small business currently uses 1 spreadsheet to store information regarding products, vendors, customers, and orders. The primary objective of this project is to design and implement a well-organized relational database model to support the company in its future business expansion, making it easier for managers to pull data needed to make informed decisions.
Original Data Storage: The Spreadsheet
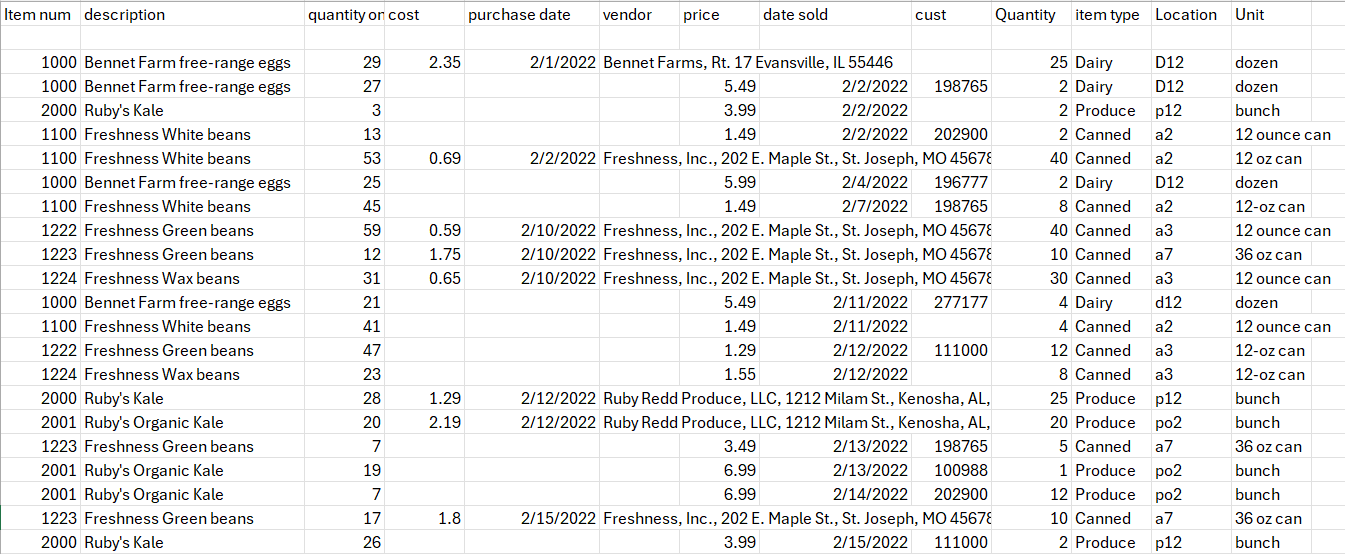
Excel Data Cleaning Process

1. Set Cost column to 2 decimal places for each record. Initially, one of the records contained only 1 decimal place.
2. Split Vendor Name, Street, City, State and Zip Code into separate columns.
3. Trimmed the extra spaces from the City, Street, State, and Zip Code fields.
4. Changed all the records in the Location field to upper case.
5. Modified the Unit of Measure field, so that each record contained a consistent format for ounces.
6. Switched the Price of eggs in the record for Customer ID 196777 from $5.99 to $5.49. I assumed this to be a typo since all of the other records for Item#1000 list the price as $5.49.
7. Change the Purchase Date and Date Sold fields to yyyymmdd format.
EER Diagram
The first step in developing the Extended Entity-Relationship (EER) model for the database was to analyze the spreadsheet, identifying the entities that are represented in the data and the fields that should be included in each table.
Upon analyzing the data, I realized there are 4 primary entities reflected in the spreadsheet, which are Customer, Vendor, Product, and Order. I initially drafted a diagram by hand to sort the fields into the respective tables.
After the handwritten draft, I began to design the model in MySQL Workbench. I leveraged ChatGPT to validate my approach and ensure best practices were followed in building the EER diagram.
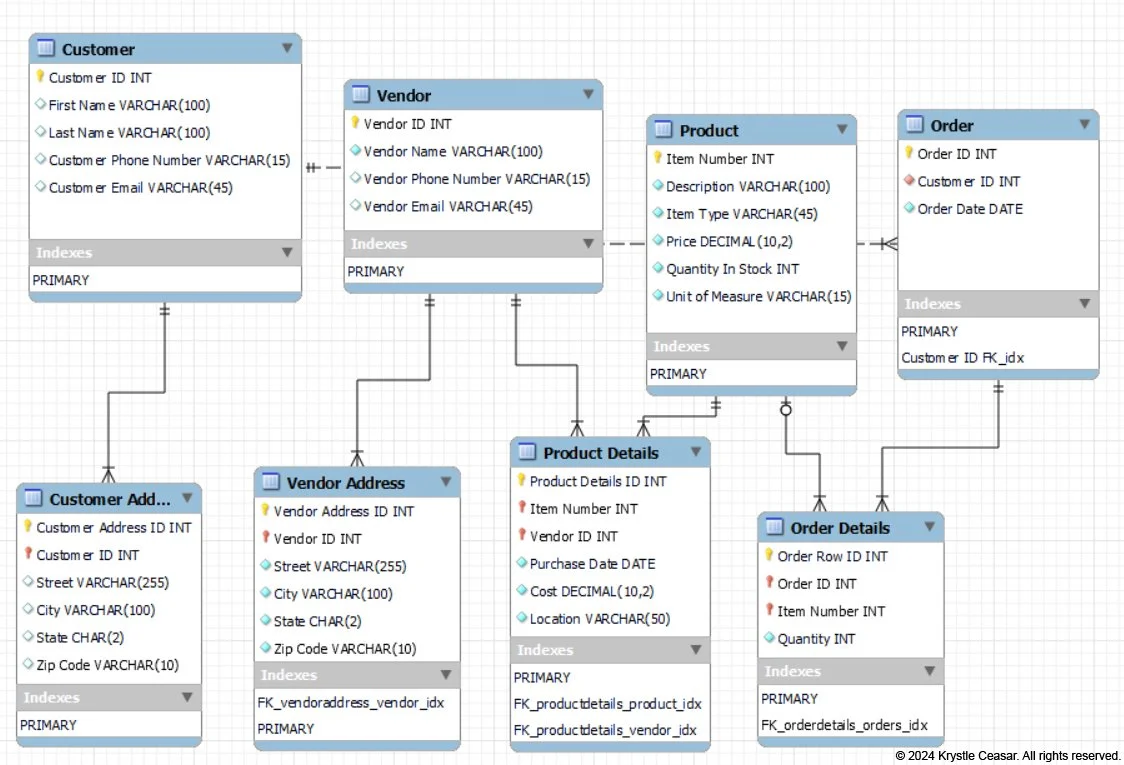
Here is the EER Diagram I developed using MySQL to help Greenspot manage its data more efficiently:
Entity Descriptions
Customer Table
The original spreadsheet includes a column with Customer IDs to represent individual customers. However, it does not include important customer data needed for CRM purposes.
I’ve added the following columns to assist: First Name, Last Name, Customer Phone Number, and Customer Email.
The company should prioritize capturing relevant data to keep track of its customers’ purchase behaviors, attitude towards the brand and particular products, and to provide more personable customer service.
Product Table
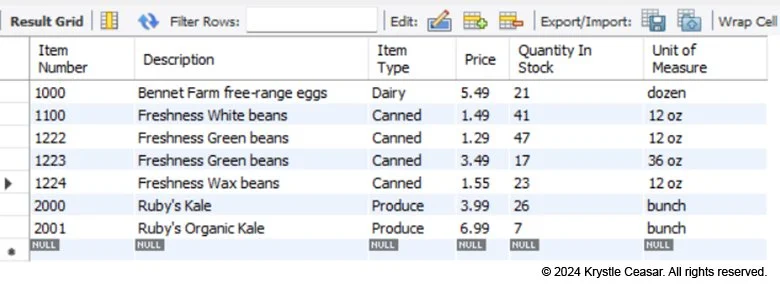
The Product table contains the most commonly accessed product attributes, such as the Item Number, Description, Item Type, Price, Quantity in Stock, and the Unit of Measure.
Entity Relationships
The 4 main entities in this database, Customer, Vendor, Product, and Order act as “Parent” tables to the other tables, which are the Customer Address, Vendor Address, Product Details, and Order Details tables. Each of these relationships are One-to-Many.
The Customer table is a parent table to the child table, Customer Address. The primary key in the Customer table, Customer ID, is a foreign key in the Customer Address table. A customer can have multiple addresses on file.
The Vendor table is a parent table to Vendor Address and Product Details table. The primary key in the Vendor table, Vendor ID, is a foreign key in both the Vendor Address and Product Details tables. Vendors can be linked to multiple addresses and products.
The Product table is a parent table to both the Product Details and Order Details tables. The Product table’s primary key, Item Number, is a foreign key in the Product Details and Order Details tables.
The Customer and Order tables share a Non-Identifying One-to-Many relationship, in which a customer can be linked to multiple orders.
Additionally, I have created a trigger that reduces the Quantity In Stock in the Product table each time the Quantity field is updated in the Order Details table.
Product Table (Before Trigger):
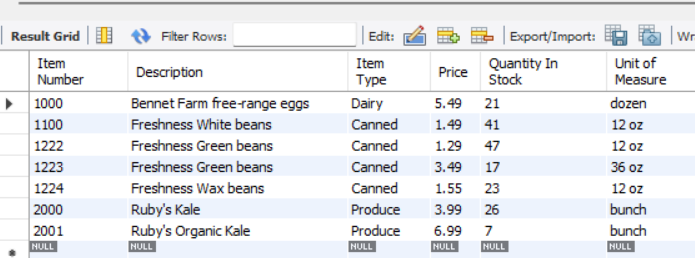
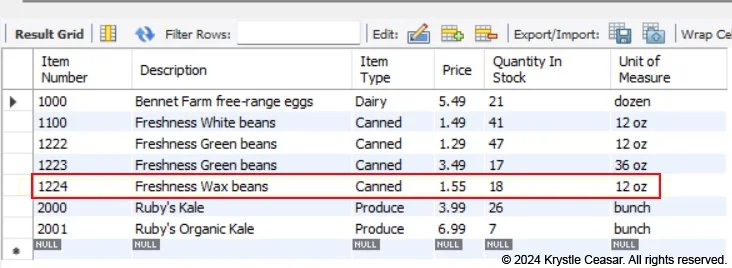
Product Table (After Trigger):
To test the trigger, I inserted a new record into the Order and Order Details table: (5) Freshness Green Beans (Item 1224)
The trigger updated the Quantity in Stock for Item 1224 from 23 to 18.
Sample Queries
Below are a few queries I’ve run to test the database design.
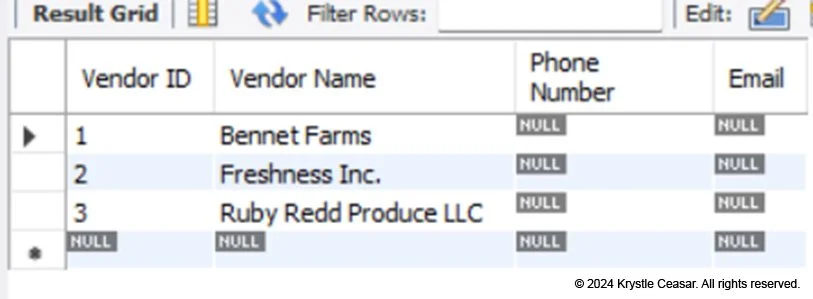
1. Vendor and Vendor Address join:

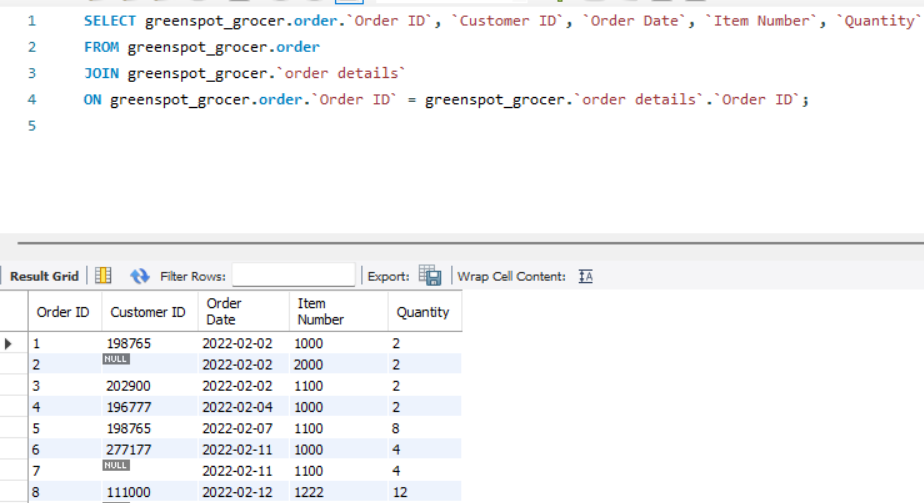
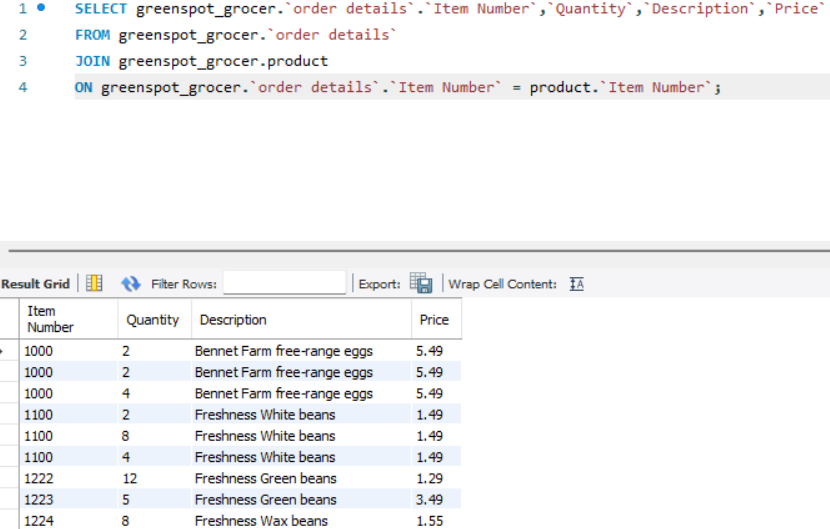
2. Order and Order Details join:
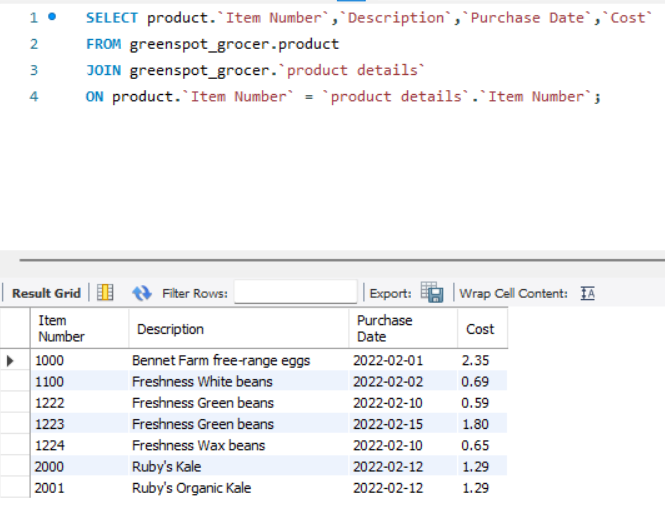
3. Product and Product Details join:
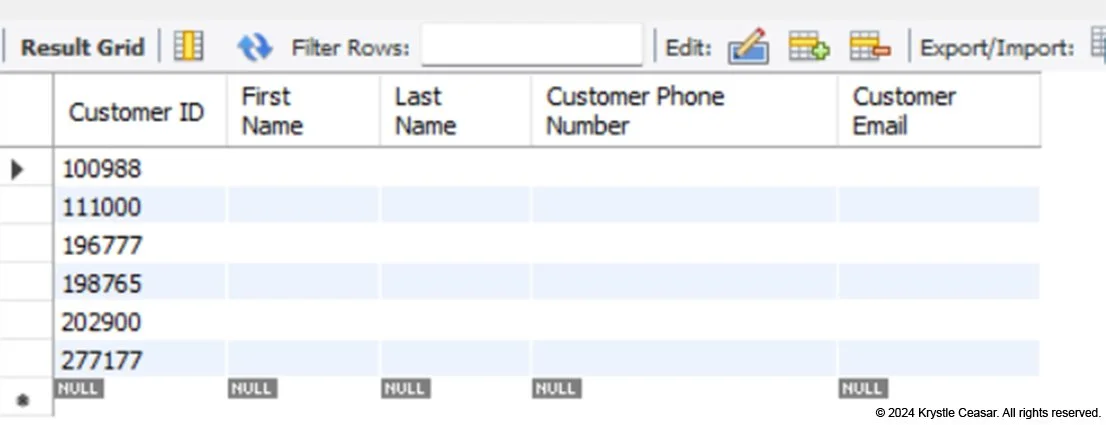
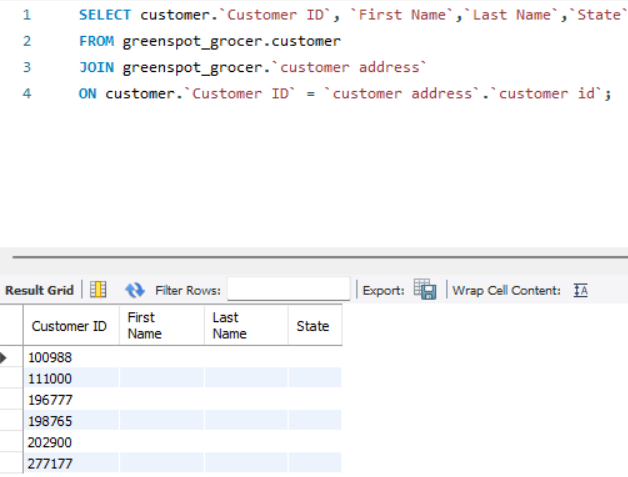
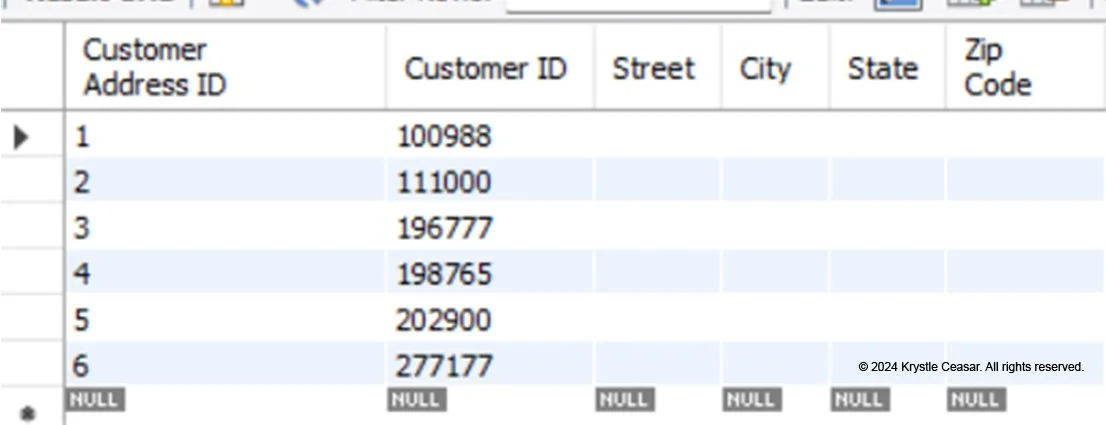
4. Customer and Customer Address join:
Recall that the company has yet to include customer names or addresses, which is why the fields are blank.
Business Insights
Please note that the synthetic dataset used in this project only covers orders from a few weeks in February of 2022, as well as 1 additional order I’ve added when I tested the Quantity In Stock trigger I created.
1. How much revenue did Greenspot Grocer earn?
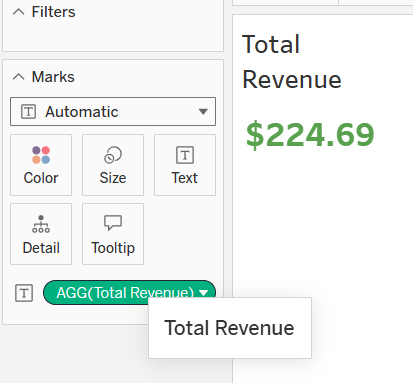
To find the total revenue earned by the company during the time frame covered in the dataset, I first ran a query in MySQL to join data from the Order Details and Product tables.
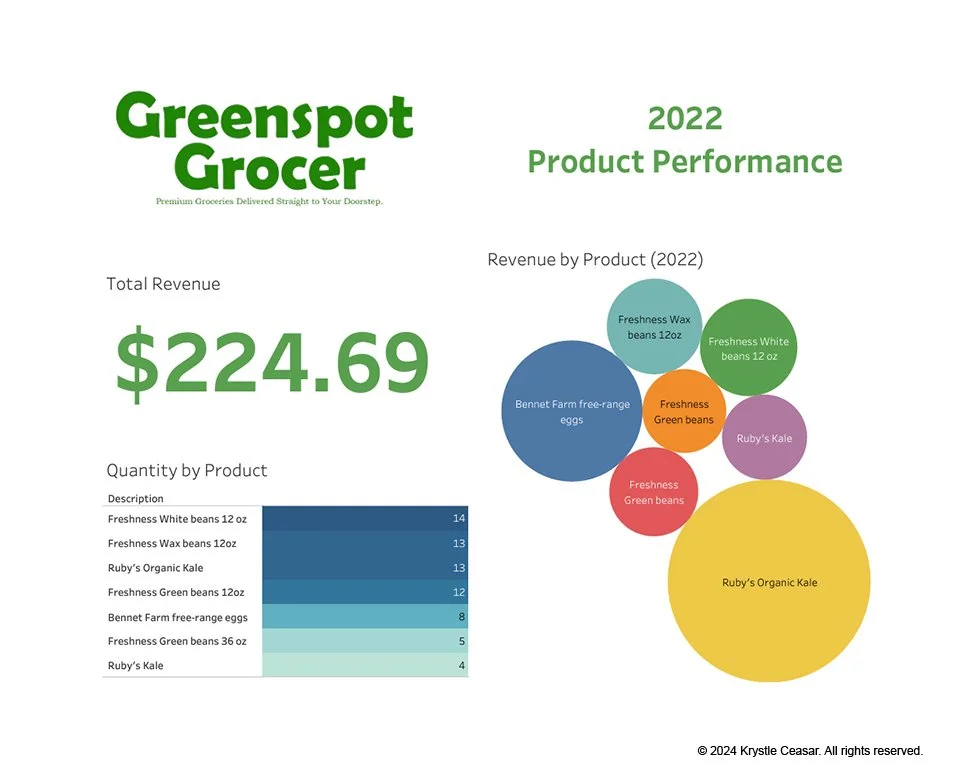
I then exported the MySQL results to a csv file. To visualize the results, I uploaded the data subset to a Tableau workbook, where I created a calculated field for Total Revenue. The Total Revenue earned by the company was $224.69.
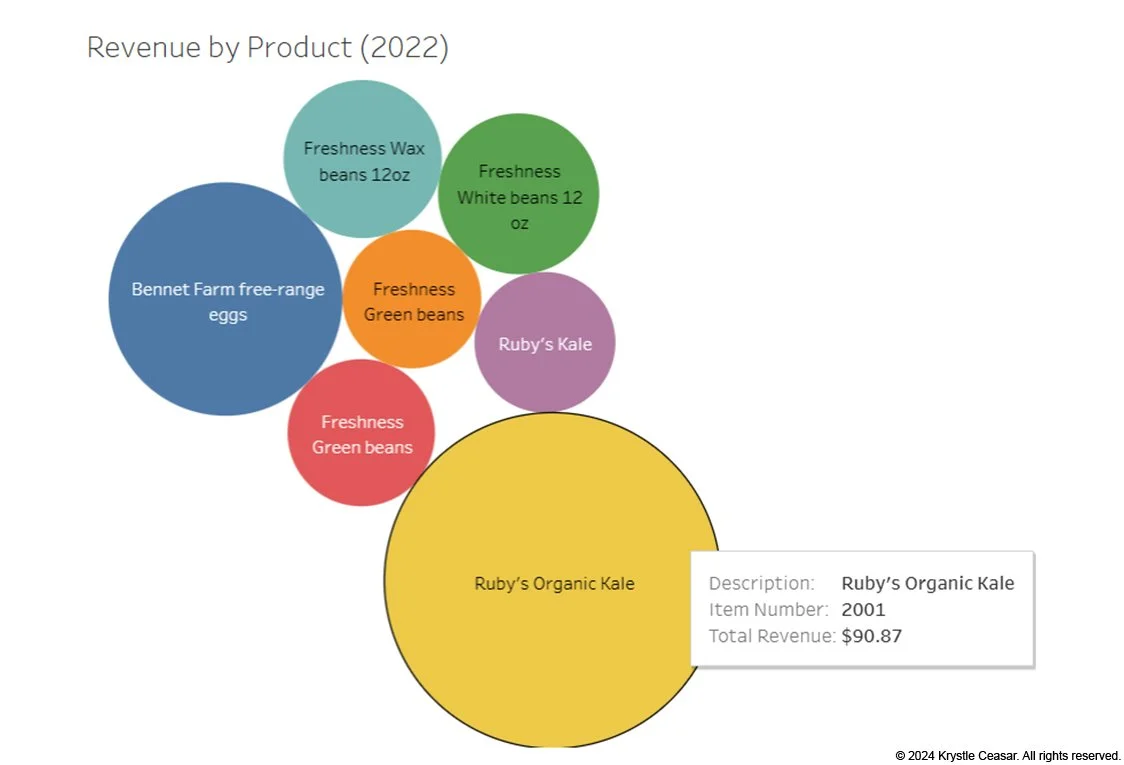
2.Which product generated the most revenue ?
As revealed in the bubble chart shown below, Ruby’s Organic Kale generated the most revenue for Greenspot Grocer.
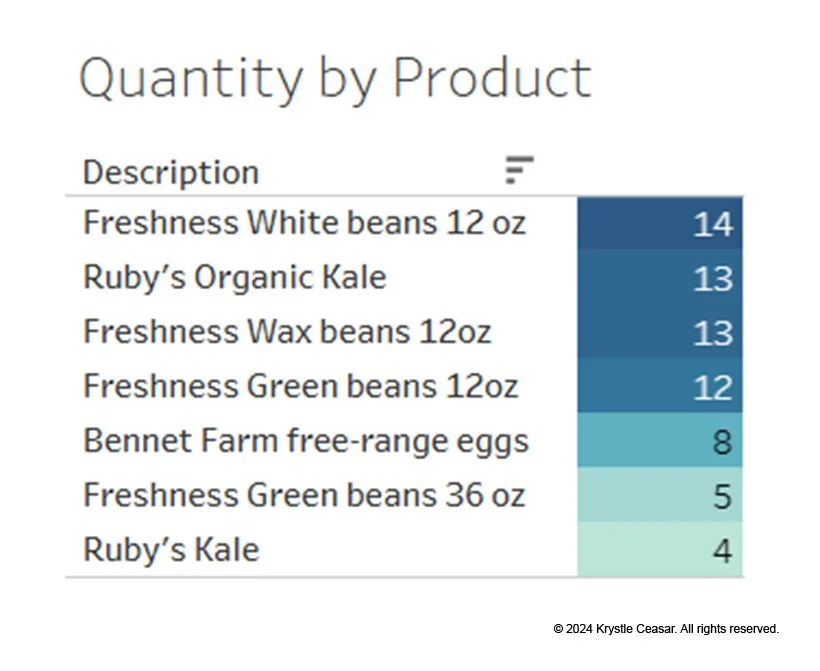
3.Which product was the most popular among Greenspot’s customers?
Freshness White Beans were the top-selling product by quantity.
Customer Address Table
Additionally, I’ve created the Customer Address table to store customer delivery addresses. This table will be useful in expediting the order process for repeat customers, shipping promotional mailers, and analyzing customer trends by geographical data.
Product Details Table
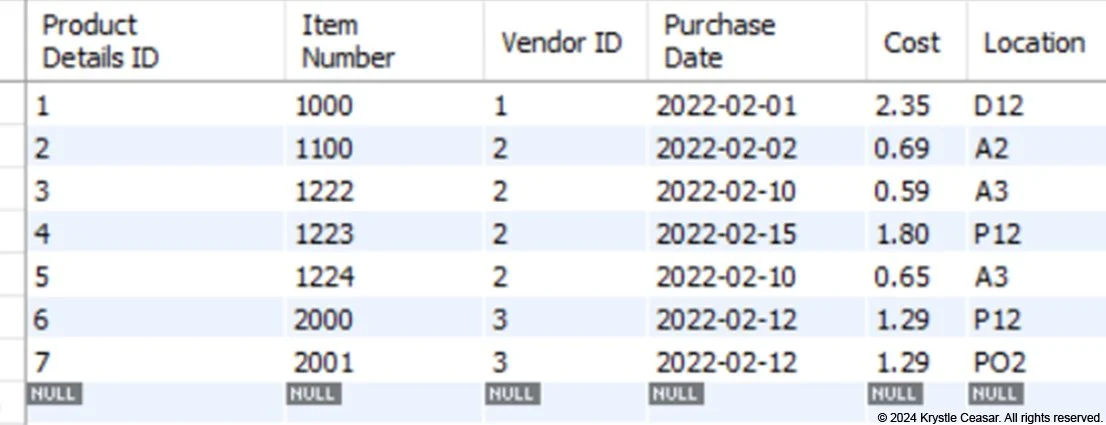
The Product Details table consists of more product details that will be used for inventory management, which includes the Item Number, Vendor ID, Purchase Date, Cost, and Location of each product.
Order Table
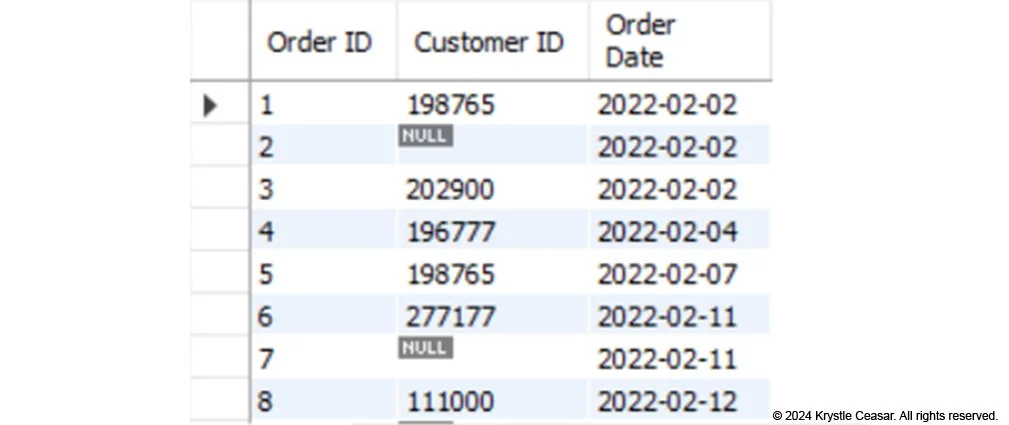
The Order table provides a high-level view of transactions, such as an Order ID, Customer ID, and Order Date column. The original spreadsheet includes missing Customer ID values for 3 orders. I decided to keep the records with missing Customer IDs for use in an overall revenue analysis.
However, the records containing a Customer ID offer more value in terms of analyzing individual customer shopping patterns.
This table can be used to reveal which customer(s) have placed the greatest number of orders within a specific time frame, as well as each customer’s most recent purchase date.
Order Details Table
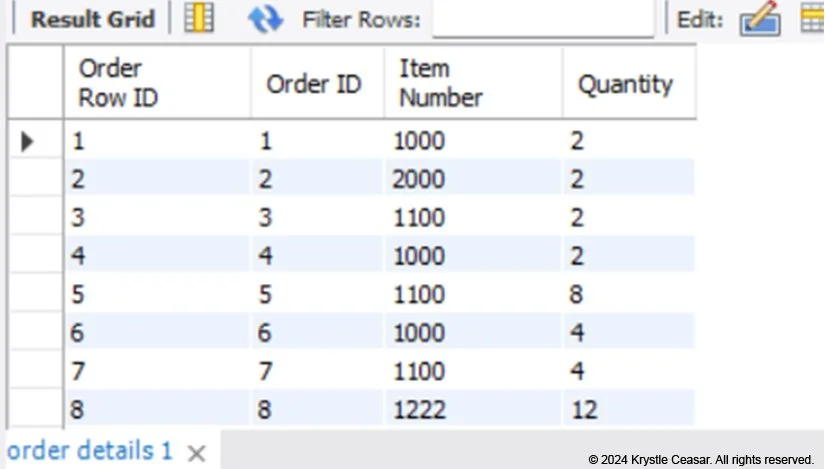
The Order Details table contains the Item Number and Quantity per item for each Order ID. Orders can contain multiple products, represented by the Item Number field in this table.
However, this particular dataset only shows 1 item per order for each customer. I have decided to treat the rows with missing Customer IDs as individual orders to avoid making incorrect assumptions about which customers purchased those items since doing so could potentially inflate the customer’s order value.
Vendor Table
Vendor Address Table
The Vendor table, a reference of the company’s suppliers, includes the Vendor ID, Vendor Name, Phone Number, and Email fields. Management can quickly access a supplier’s contact information to place a purchase order or follow up on a pre-existing order.
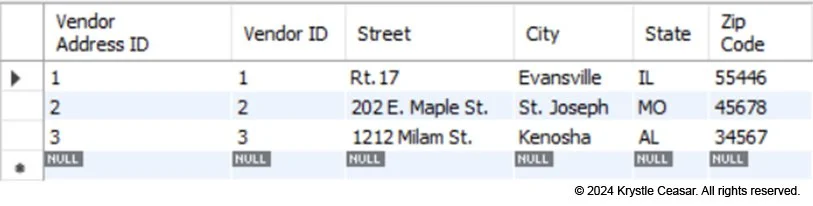
The Vendor Address table consists of the Vendor ID, Street, City, State, and Zip Code columns.