Inventory Optimization Analysis
Using MySQL Workbench

Project Overview
In this project, I analyzed the database of a fictional retailer of model classic cars called, Mint Classics. The company was looking to reduce fixed costs by potentially closing down one of its four warehouses. I imported the database into MySQL Workbench and executed SQL queries to identify opportunities for inventory reduction, reorganization and facility closure. The queries I executed included the Warehouses, Products, Orders, and Order Details tables, as these tables contain fields that are relevant to solving the business problem at hand.
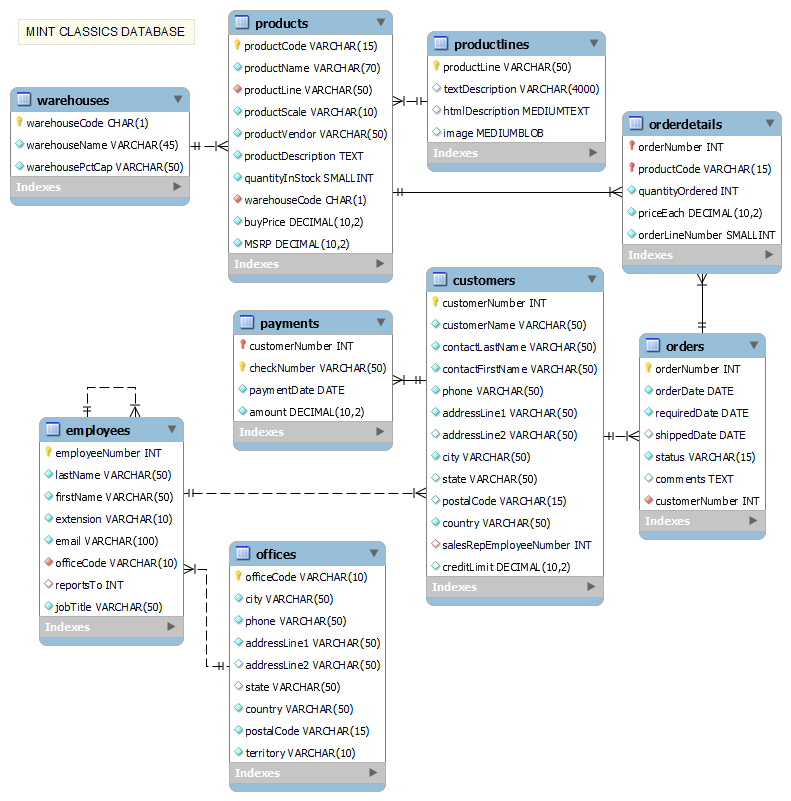
EER Diagram for Mint Classics Schema
Designed by Freepik
Warehouses Table
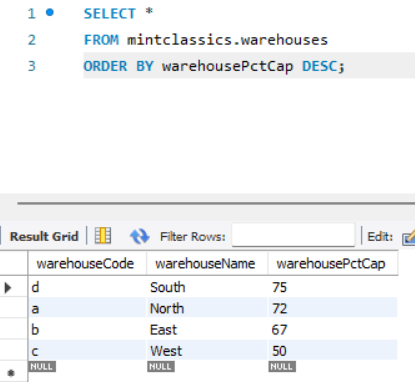
After reviewing the structure of the database and the relationships between the tables, I queried the Warehouses table to find out how many warehouses Mint Classics utilizes, each warehouse code and name, as well as the current percent capacity of each warehouse.
Key Findings:
Mint Classics stores its products in 4 warehouses.
Each Warehouse has a unique identifier called a Warehouse Code, which is the primary key in the Warehouses table.
Warehouse A, the North warehouse, is currently at 72% storage capacity.
Warehouse B, the East warehouse, is currently at 67% storage capacity.
Warehouse C, the West warehouse, is currently at 50% storage capacity.
Warehouse D, the South warehouse, is currently at 75% storage capacity.
Products Table
Next, I queried the Products table to learn more about Mint Classics’ products and find out which product lines were being stored in each Warehouse.

Total Number of Products

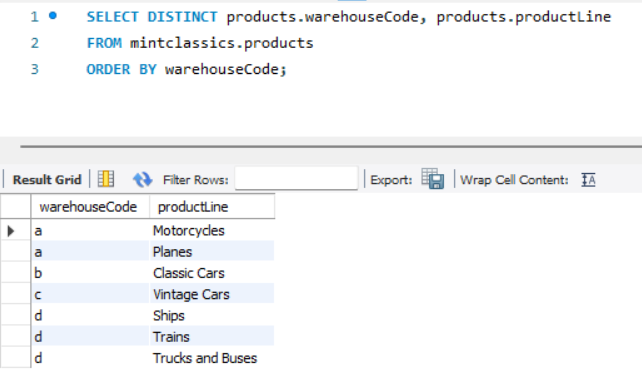
Product Lines by Warehouse
Key Findings:
Each product is identified by a Product Code which is the primary key in the Products table.
Mint Classics has a total of 110 model car products.
Warehouse A stores products from the Motorcycles and Planes product lines.
Warehouse B only stores products from the Classic Cars product line.
Warehouse C only stores products from the Vintage Cars product line.
Warehouse D stores products from the Ships, Trains and Trucks and Buses product lines.
After familiarizing myself with the company’s storage system and product offerings, I analyzed each warehouse to identify inventory imbalances, excessive costs, and the storage of underperforming products.
I prioritized my analysis based on the warehouses' percent capacity, starting with Warehouse D, which is operating at 75% capacity—nearly full. Reducing the capacity of Warehouse D should be the company’s first priority to prevent excess products from being redistributed to other warehouses, potentially leading to further inefficiencies.
Warehouse D (South)
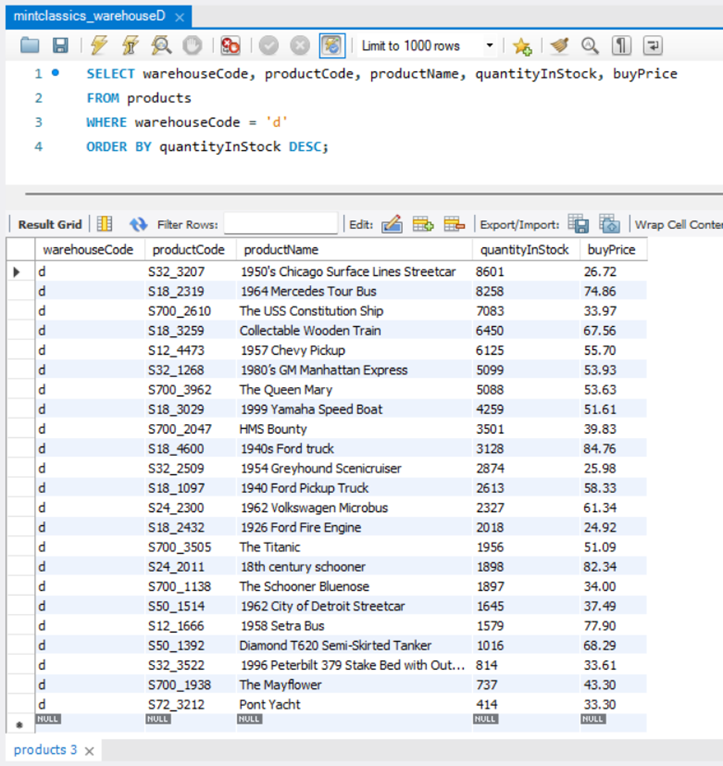
I began my analysis of Warehouse D by writing a SQL query to retrieve key information from the Products table. The query selected the warehouseCode, productCode, productName, quantityInStock, and buyPrice columns, filtering specifically for rows where the warehouseCode was 'D'. I sorted the results by the quantityInStock column in descending order to identify the products with the highest inventory levels in Warehouse D.
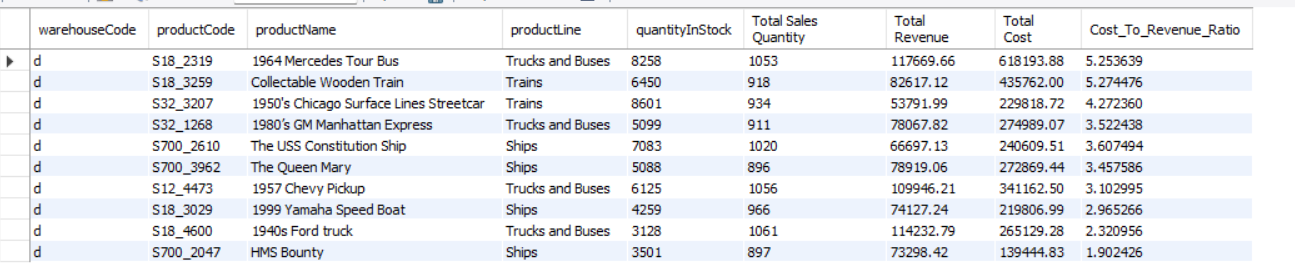
This analysis revealed that Product S32_3207 (1950s Chicago Surface Lines Streetcar) has the highest quantity in stock in Warehouse D, followed by Product S18_2319 (1964 Mercedes Tour Bus).
To delve deeper, I calculated the total cost of each product stored in Warehouse D to determine which items represent the highest cost to Mint Classics.

Product S18_2319 (1964 Mercedes Tour Bus) is the costliest product in Warehouse D in terms of Total Cost . With a current stock of 8,258 units and a per-unit cost of $74.86, the total cost for this product amounts to $618,193.88.
To further evaluate the profitability of high-cost products in Warehouse D, I submitted another query that included calculated fields for the Total Revenue and Cost-to-Revenue Ratio. These metrics allowed me to assess the financial performance of these products more comprehensively.
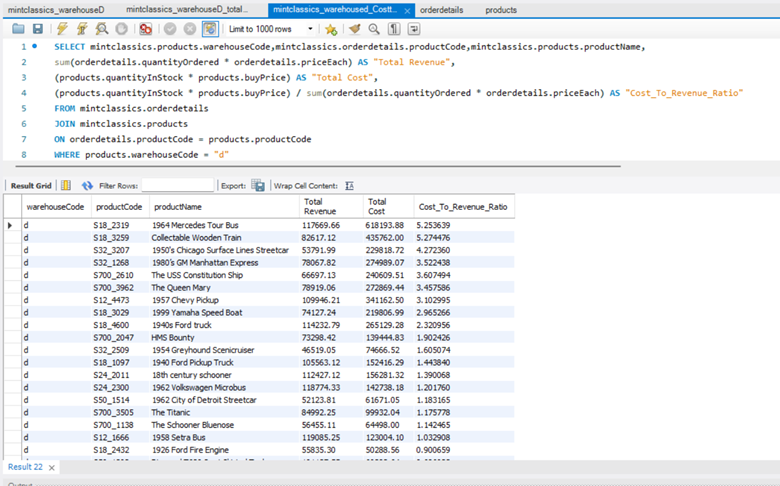
To analyze the profitability of each product in Warehouse D, I joined the Products table and the OrderDetails table using the primary key, productCode. I then created calculated fields for Total Revenue, Total Cost, and the Cost-To-Revenue Ratio.
Total Revenue: An aggregated sum of (quantityOrdered * buyPrice) for each product in Warehouse D.
Total Cost: Calculated as (quantityInStock * buyPrice) for each product in Warehouse D.
Cost-To-Revenue Ratio: The ratio of total cost to total revenue for each product, providing insight into profitability.
Key Findings:
Product S18_2319 (1964 Mercedes Tour Bus), previously identified as the costliest product in Warehouse D due to its high total cost, has a Cost-To-Revenue Ratio of 5.25, making it the second least profitable item in the warehouse.
Product S18_3259 (Collectible Wooden Train) is the least profitable product, with a Cost-To-Revenue Ratio of 5.27.
Additional non-profitable items in Warehouse D include Product S32_3207 (1950s Chicago Surface Lines Streetcar), Product S32_1268 (1980s GM Manhattan Express), Product S700_2610 (USS Constitution Ship), Product S700_3962 (Queen Mary), and Product S12_4473 (1957 Chevy Pickup).
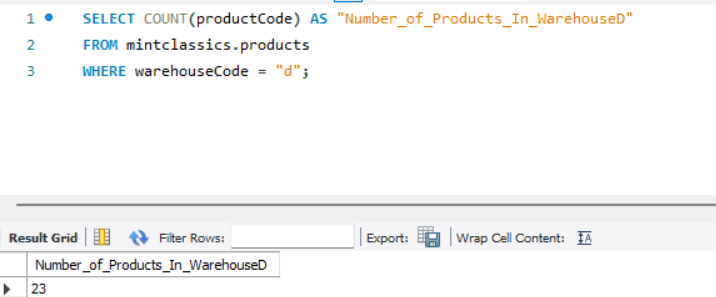
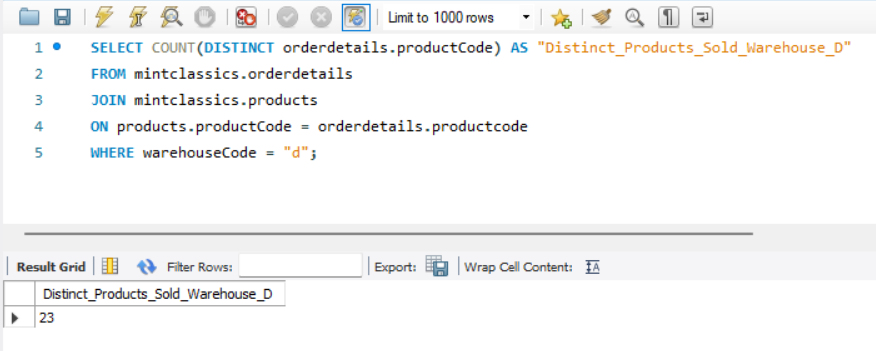
Every product in Warehouse D has made sales:
Number of Distinct Products Stored: Number of Distinct Products Sold:
Cost-to-Revenue Analysis
Warehouse A (North)
Next, I analyzed Warehouse A, which is approaching full capacity at 72%. This analysis showed that Product S12_2823 (2002 Suzuki XREO) has the highest stock in the warehouse, with 9,997 units currently stored. It is followed by Product S700_2466 (America West Airlines B757-200), and Product S32_2206 (1982 Ducati 996 R) with 9,653 units and 9,241 units in stock, respectively.

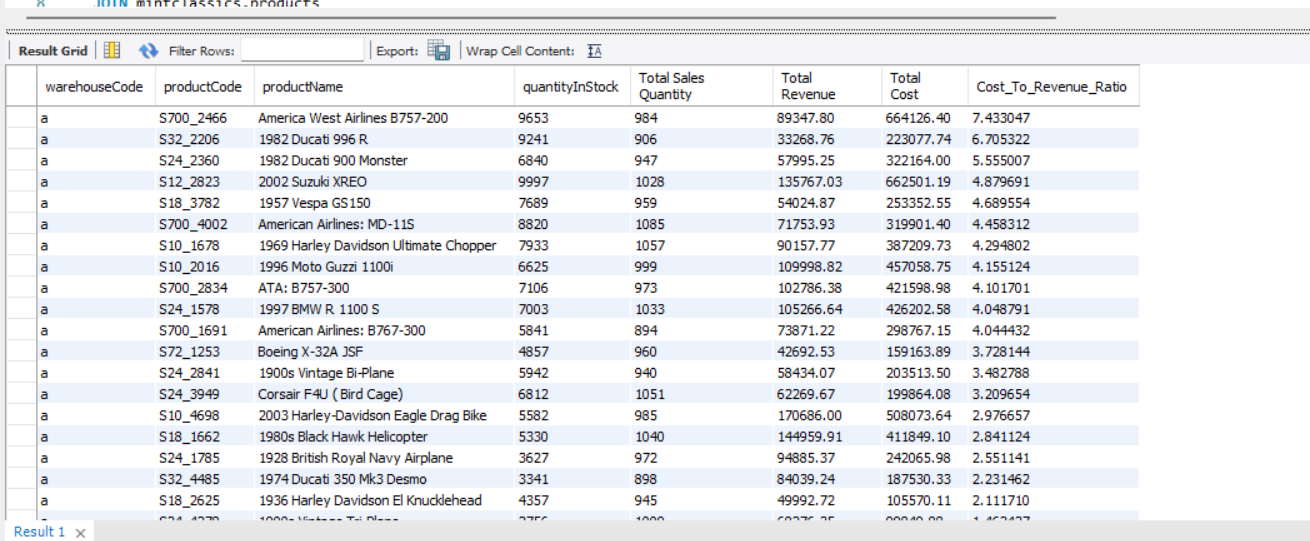
Cost-to-Revenue Analysis
Key Findings:
Product S700_2466 (America West Airlines B757-200) is the costliest in terms of Total Cost of products currently stored in Warehouse A, as well as the least profitable with a Cost-To-Revenue Ratio of 7.43.
Additional non-profitable items in Warehouse A include Product S32_2206 (1982 Ducati 996 R), Product S24_2360 (1982 Ducati 900 Monster), and Product S12_2823 (2002 Suzuki XREO), which has also been identified as the product with the highest stock quantity in the warehouse.
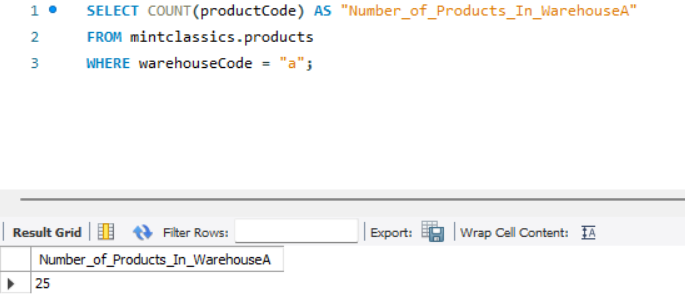
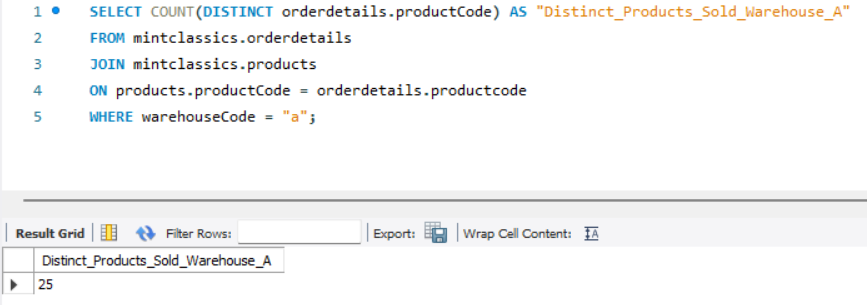
Every product in Warehouse A has made sales:
Number of Distinct Products Stored: Number of Distinct Products Sold:
Warehouse B (East)
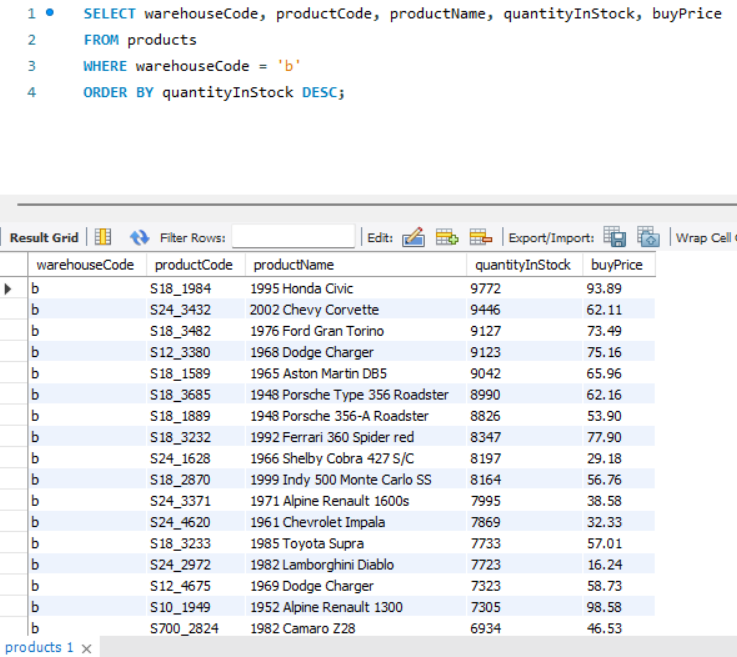
After analyzing Warehouse A, I then analyzed Warehouse B, which is currently at 67% percent storage capacity.
I discovered that Product S18_1984 (1995 Honda Civic) has the highest stock in Warehouse B, with 9,772 units stored. It is followed by Product S24_3432 (2002 Chevy Corvette) and Product S18_3482 (1976 Ford Gran Torino) with 9,446 units and 9,127 units in stock, respectively.
Cost-to-Revenue Analysis
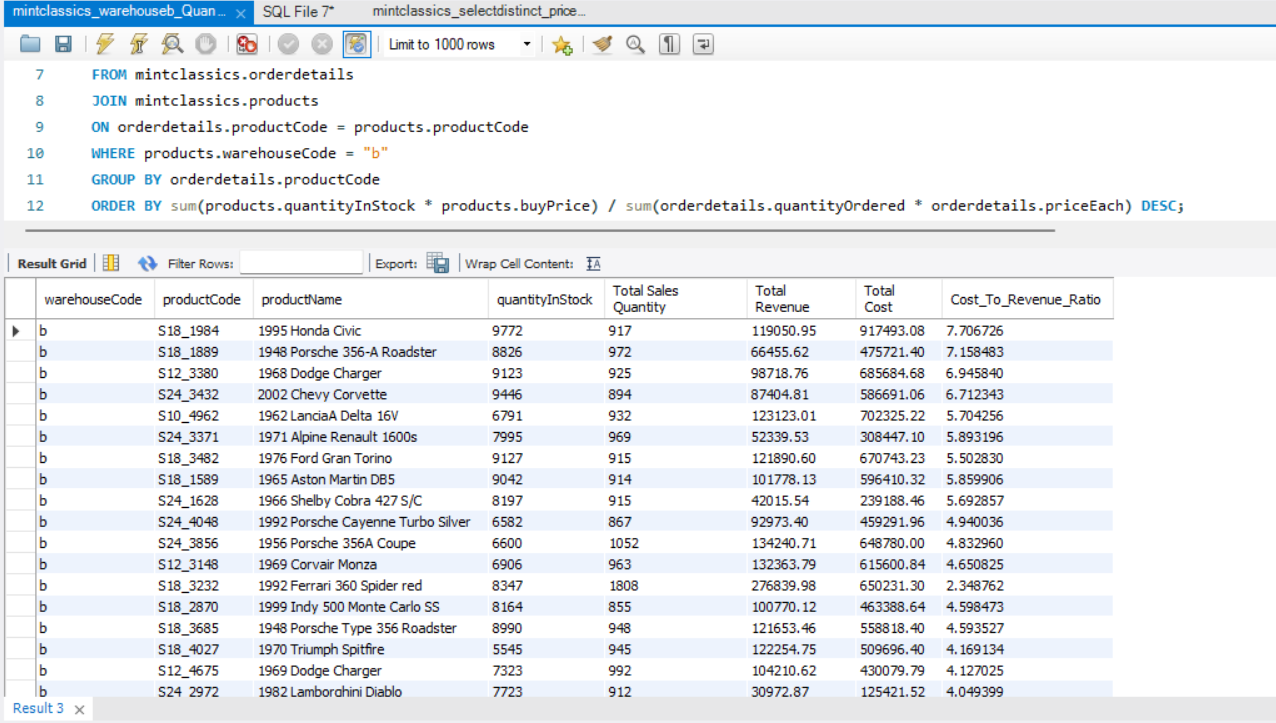
Key Findings:
Product S18_1984 (1995 Honda Civic) is the costliest in terms of Total Cost of products currently stored in Warehouse B, as well as the least profitable with a Cost-To-Revenue Ratio of 7.71.
Additional non-profitable items in Warehouse B include Product S18_1889 (1948 Porsche 356-A Roadster), Product S12_3380 (1968 Dodge Charger), and Product S24_3432 (2002 Chevy Corvette), among others.
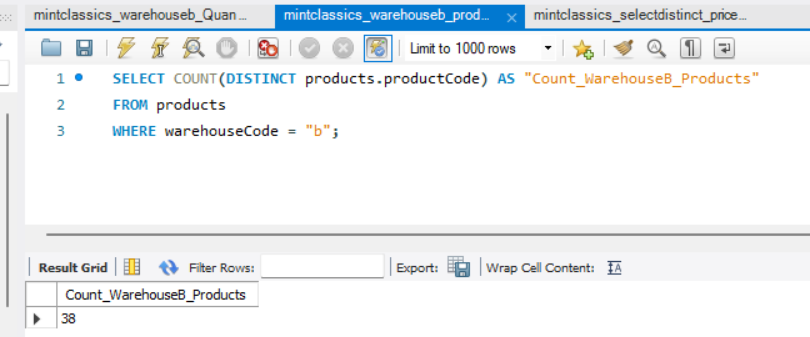
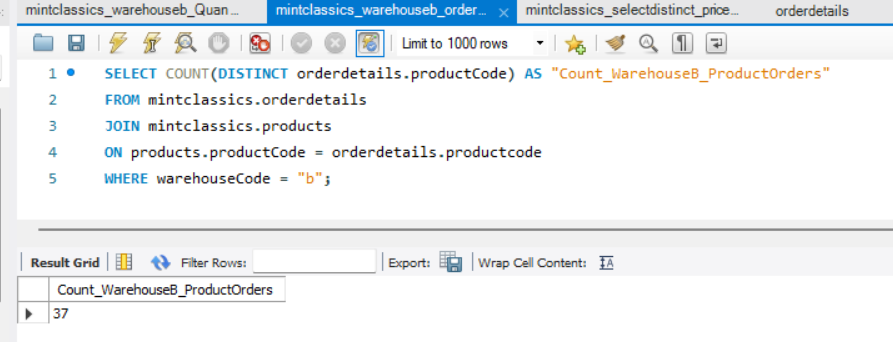
Warehouse B contains 38 products, but the Order Details table shows purchases for only 37 of them. This indicates that one product stored in the warehouse has not been sold in years.
Number of Distinct Products Stored: Number of Distinct Products Sold:
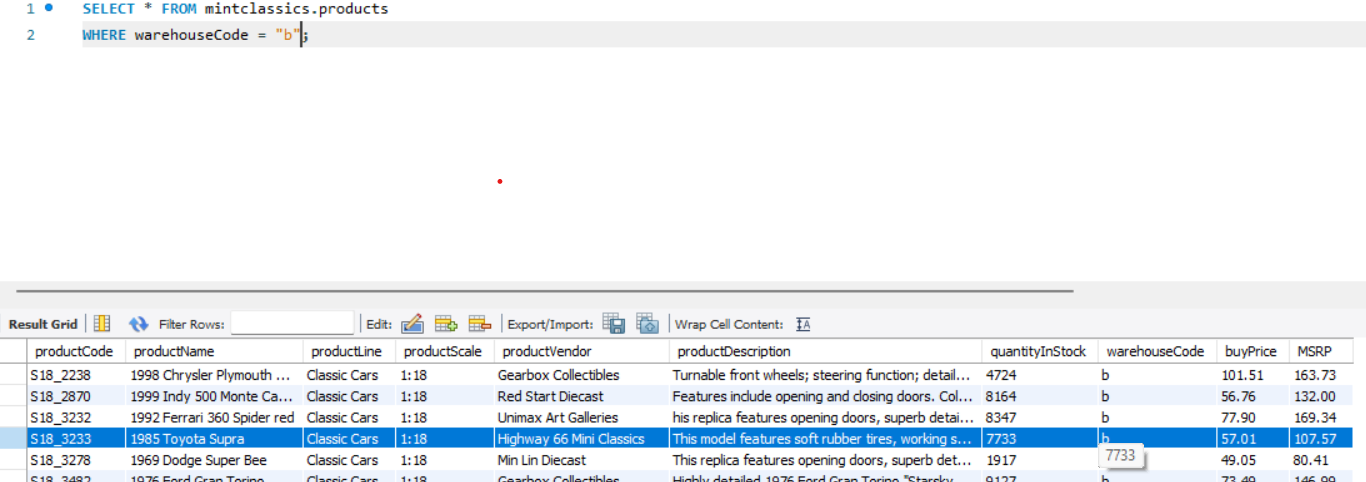
Identifying Unsold Inventory in Warehouse B
I identified the product in Warehouse B that has not sold in years by selecting the Product Code, Product Name, and Warehouse Code from the Products table and performing a LEFT JOIN with the Order Details table. I included a WHERE clause to filter only the product in Warehouse B that is not present in the Order Details table, concluding that this product has no sales. Through this query, I discovered that Product S18_3233 (1985 Toyota Supra) has remained unsold in recent years.
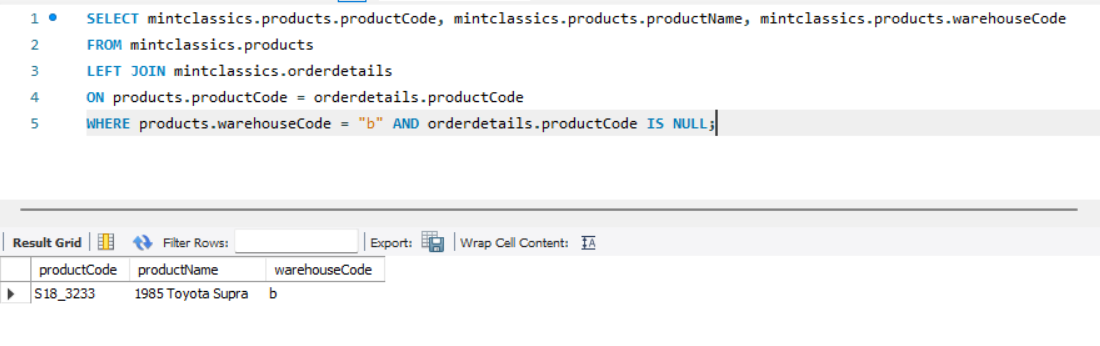
With 7,733 units of the 1985 Toyota Supra currently in stock, Mint Classics needs to develop a strategy for moving this product out of Warehouse B.
Warehouse C (West)
Lastly, I examined Warehouse C, which is operating at 50% capacity. Product S18_2325 (1932 Model A Ford J-Coupe) has the highest stock in Warehouse C, with 9,354 units in stock.
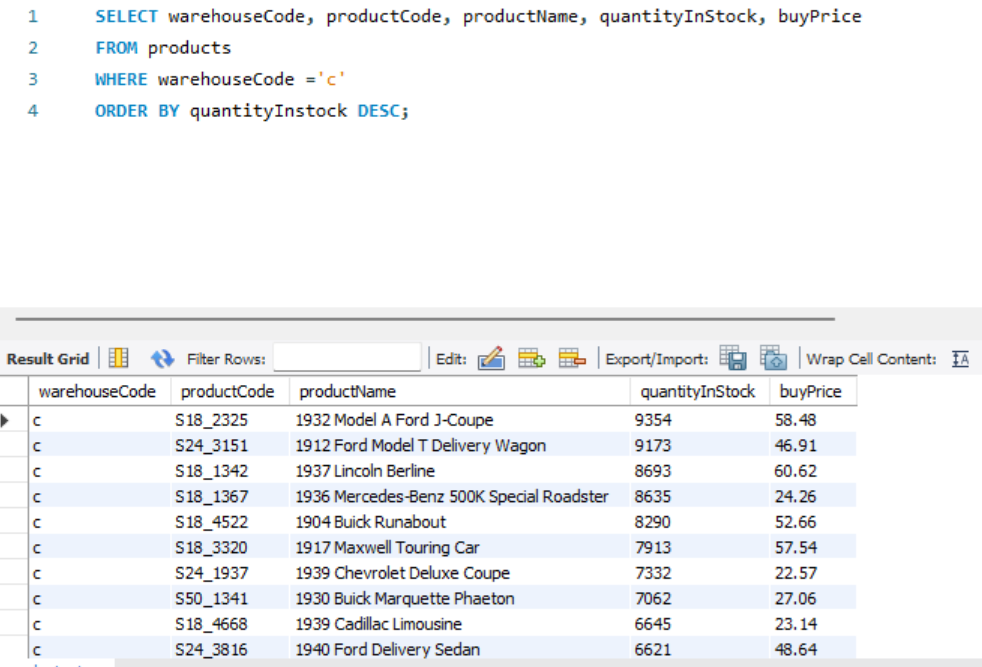
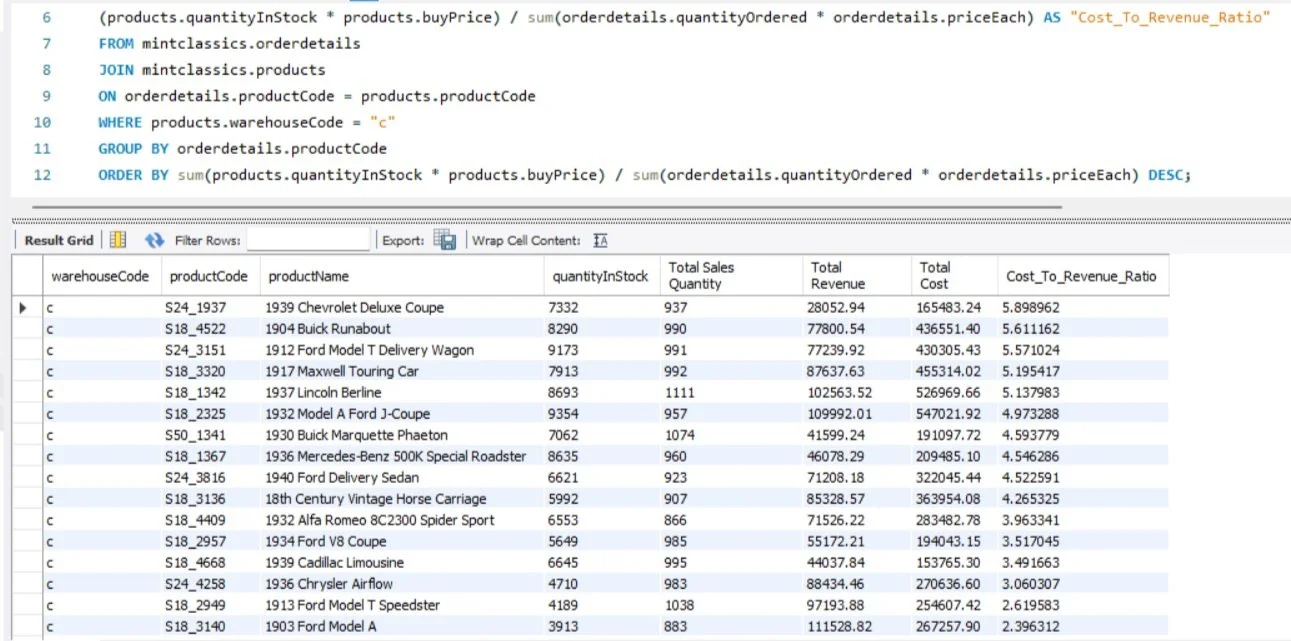
Similar to the other warehouses, many of the products stored in the warehouse have a high Cost-to-Revenue Ratio, reflecting significant unprofitability. However, some of the least profitable products stored in Warehouse C include: S24_1937 (1939 Chevrolet Deluxe Coupe), S18_4522 (1904 Buick Runabout), and the S24_3151 (1912 Ford Model T Delivery Wagon).
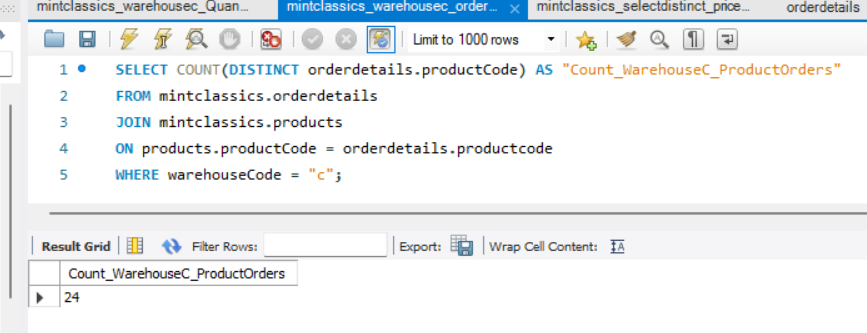
Number of Distinct Products Stored
Number of Distinct Products Sold
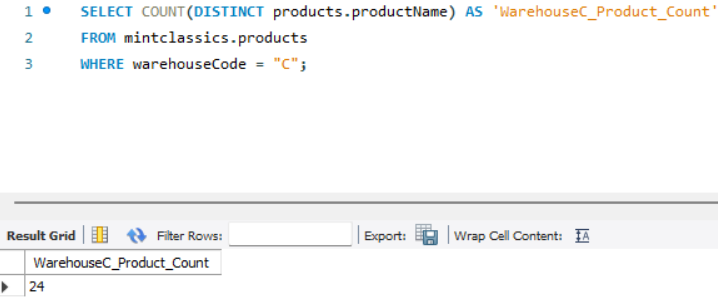
Count queries show that each of the distinct products stored in Warehouse C have been sold.
Recommendations
Propose cost renegotiations with suppliers of products with Cost-to-Revenue ratios greater than 1. If vendors agree to reduced purchase prices, Mint Classics can reduce the prices of certain products, leading to increased sales and inventory reduction.
Offer product bundles of complementary products stored in different warehouses to reduce inventory across warehouses.
Since the 1985 Toyota Supra (S18_3233) hasn’t sold in years, it should be placed on clearance so that it can be removed from Warehouse B.
Mint Classics should be able to decrease its storage costs by closing Warehouse C, which is currently only at 50% storage capacity. Once stock quantities are reduced from Warehouse A, B, C, and D due to increased sales and clearance of the Toyota Supra, distribute the remaining products in Warehouse C amongst A, B, and D.