Exploratory Factor Analysis on Survey Data
Data Source:Cengage Learning
Project Overview
This project was one of my Market Research course assignments. Our instructor provided us with the “Oldskoolnew” dataset from our textbook publisher, Cengage Learning. The objective of this assignment was to conduct an Exploratory Factor Analysis to reduce the number of variables needed to represent a respondent’s opinions about athletes in college sports today.
Case Study
Old School versus New School Sports Fans
Three academic researchers investigated the idea that, in American sports and society, there are segments with conflicting views about the goal of competition in society (i.e., winning versus self-actualization) and the acceptable/desirable way of achieving this goal. Persons who believe in “winning at any cost” in sports can be labeled new school individuals according to the researchers. The new school is founded on notions of the individual before the team, loyalty to the highest bidder, and high-tech production and consumption of professional sports. On the other hand, people may value the traditions and process of sports more highly. They believe that “how you play the game matters.” The researchers label these individuals as old school individuals. The old school emerges from old-fashioned American notions of the team before the player, sportsmanship, and competition simply for “love of the game.”
The researchers tried to measure New School/Old School orientation by asking agreement with several attitude statements (the survey contained over 15 items in total but only 10 were used here after some initial analyses). The scores on these ten statements allowed the researchers to form a composite measure representing Old School orientations. Based on their composite scores, respondents were grouped into low, middle, and high Old School groups. A low Old School orientation conversely could be thought of as a high New School orientation (Babin & Zikmund,2016, p.441).
Source: Babin, B. J., & Zikmund, W. G. (2016). Exploring Marketing Research (11th ed.). Cengage Learning.
Exploratory Factor Analysis
Research Question: Use the Oldskool data set. The survey captured responses to 9-Point disagree-agree attitudinal scales. Conduct a factor analysis with the goal of reducing the number of variables needed to represent a respondent’s opinions about athletes in college sports today. How many factors emerge? Profile each Factor.
Tool Used: JASP
Analysis:
I conducted a factor analysis utilizing the Oldskoolnew JASP file to reduce the number of variables needed to represent a respondent’s opinions about college athletes. After opening the Oldskoolnew JASP file, I selected Exploratory Factor Analysis under the Factor module. Next, I added the seventeen relevant variables to the Variables section. In the Exploratory Factor Analysis dialog box, I selected an Orthogonal Rotation and Varimax, so that the factors would be unrelated to one another. I also selected Number of Factors based on Eigenvalues above 1. Finally, under the Output Options tab, I selected Structure Matrix under Tables.
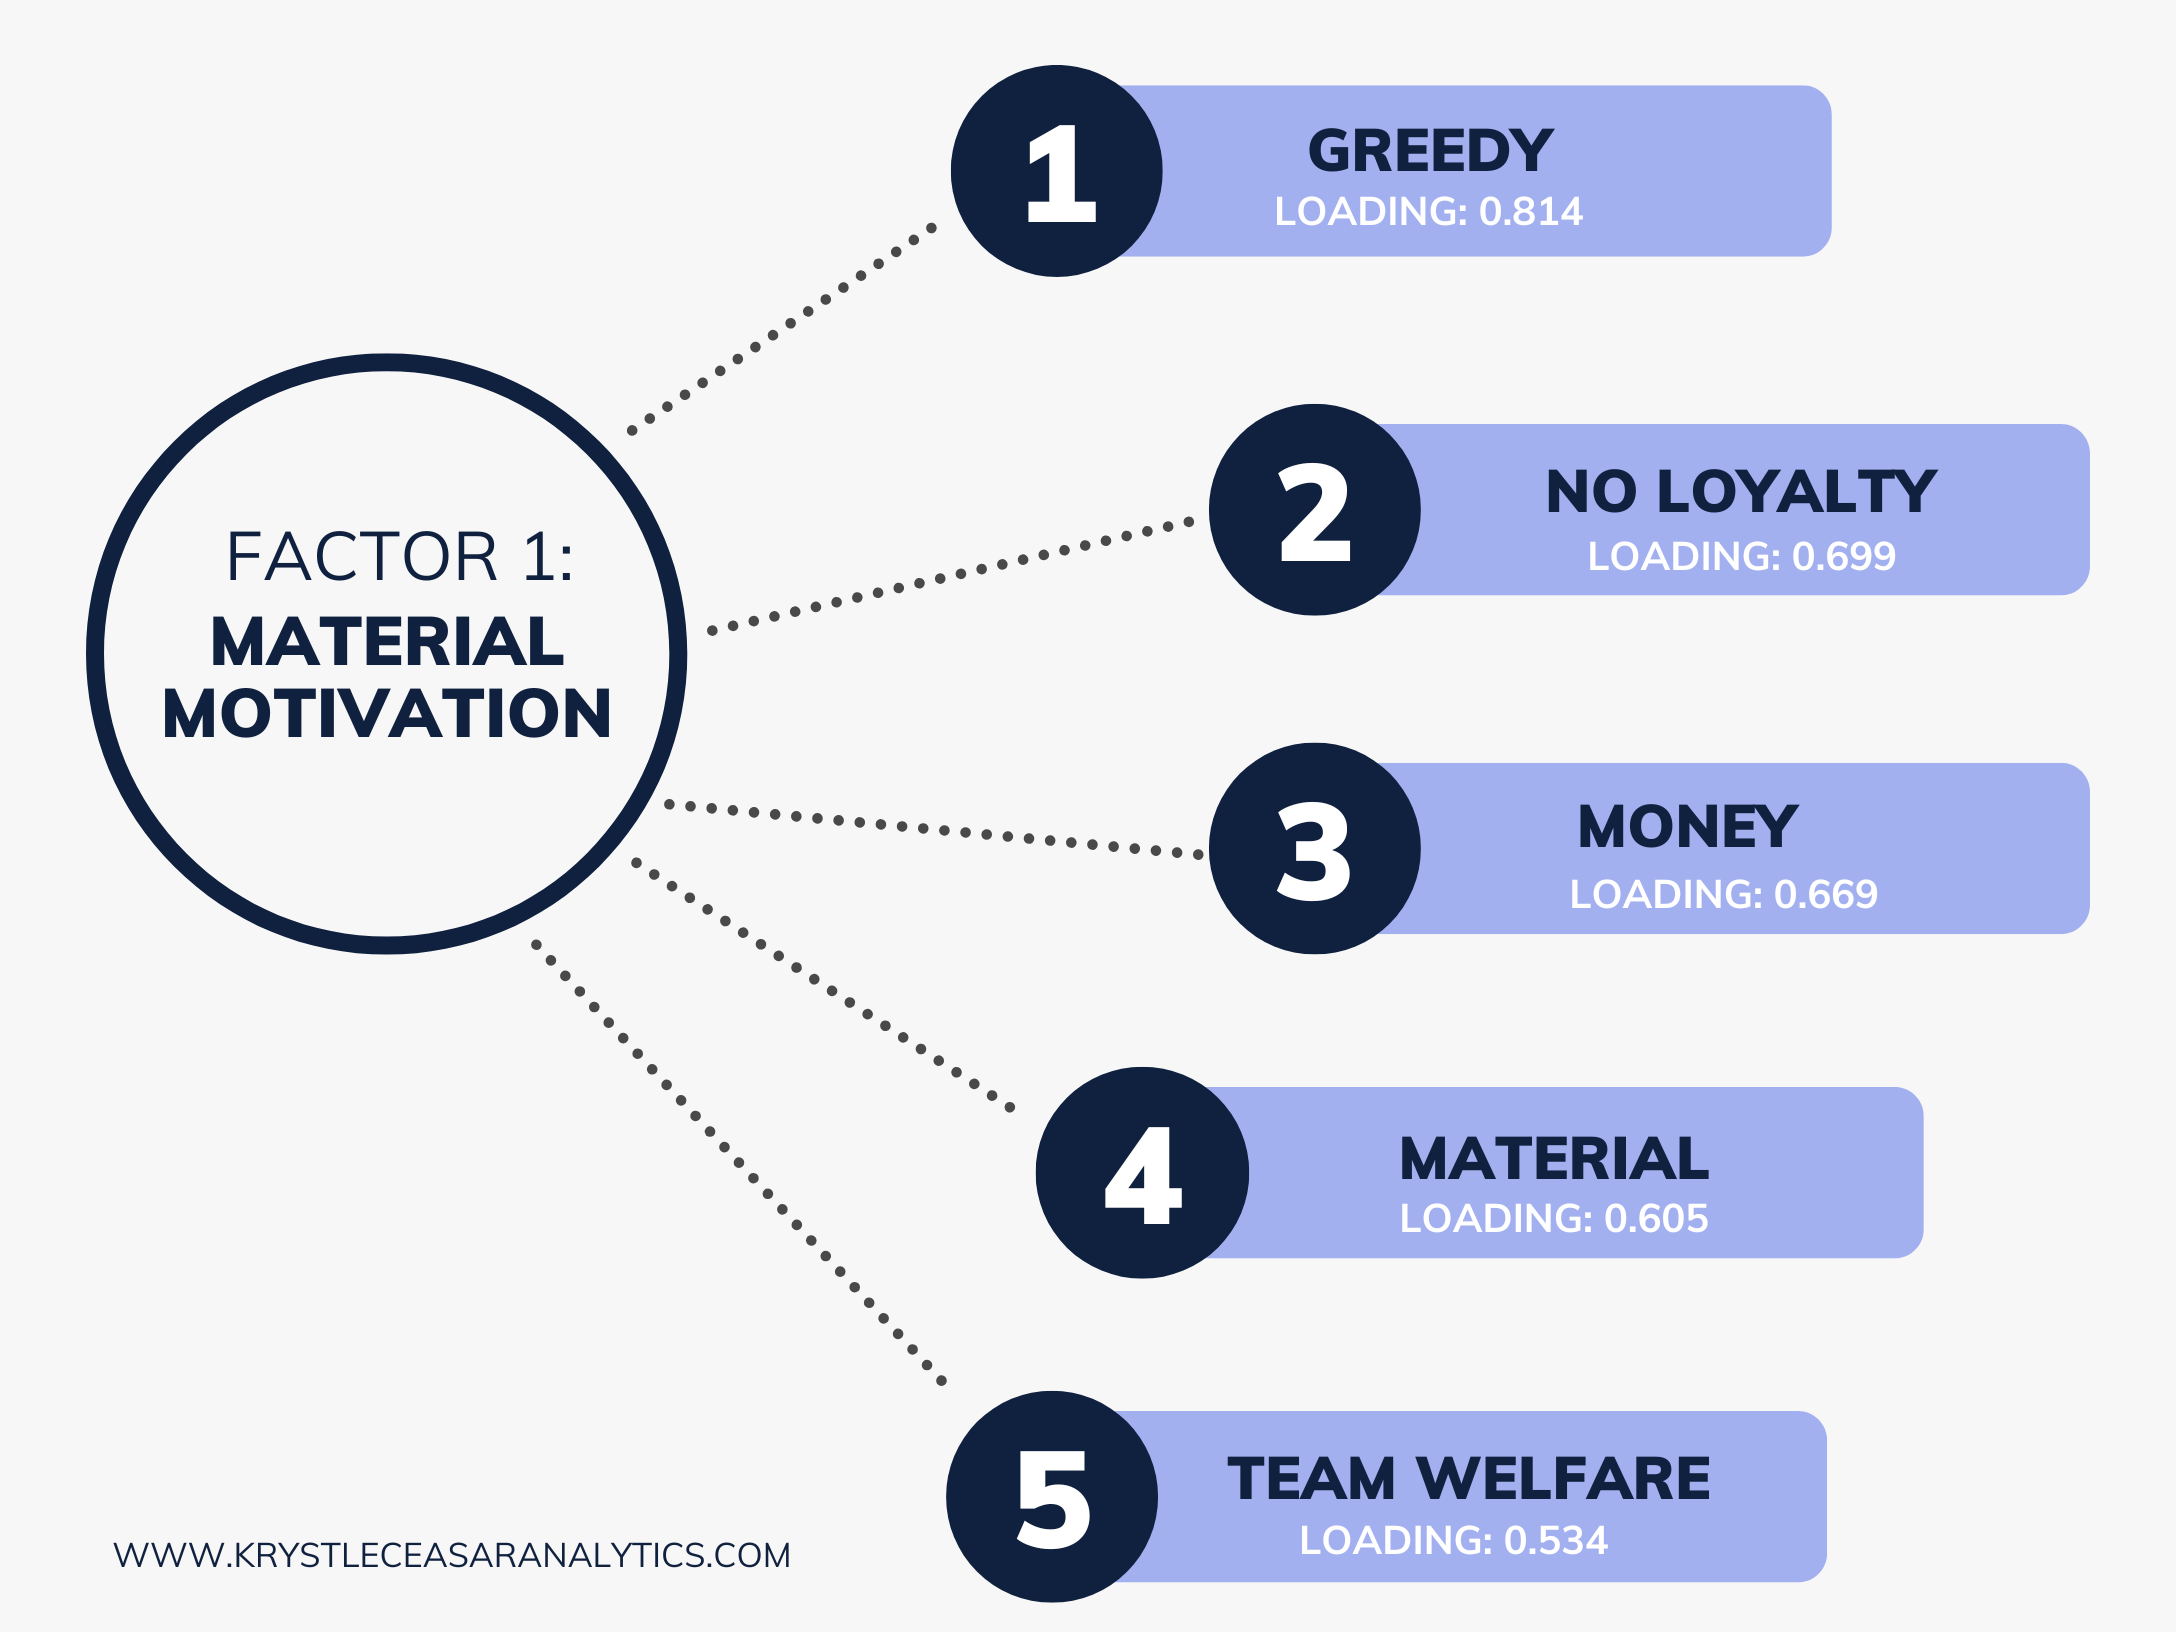
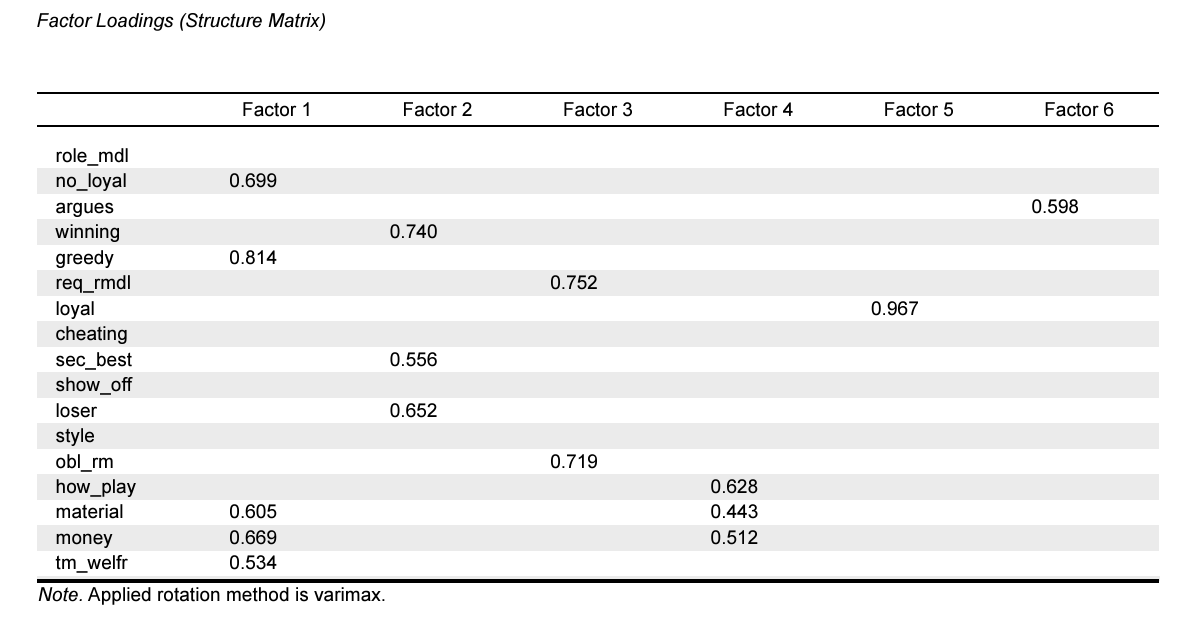
Six factors emerged from the analysis. The Structure Matrix shown above provides details about the variables that belong to each factor, as well as the loading of each variable on its factor(s). Factor 1 includes the variables, greedy, no_loyal, money, material, and tm_wellfare, which appears to reflect attitudes toward college athletes’ financial and material interests. One could assume that Factor 1 represents responses regarding views of college athletes’ material motivation. Greedy, with a factor loading of 0.814, has the highest loading on Factor 1. This indicates that the variable is strongly correlated with Factor 1, meaning that it plays a major role in defining the concept of Factor 1, which appears to relate to college athletes’ material motivation.
Factor 2 contains winning, loser, sec_best, which seems to represent views on the athletes’ competitiveness. Winning, with a loading of 0.740, has the strongest correlation with Factor 2.
Factor 3 includes req_rmdl and obl_rm with similar loadings of 0.75 and 0.719, respectively, suggesting that both variables are equally correlated with the factor.
Factor 4, consisting of how_play, material, and money, includes two variables (material, and money) that also appear in Factor 1. According to our textbook, the how_play variable reflects the belief that “how you play the game matters” (Babin & Zikmund, 2016, p.441). With the highest factor loading of 0.628, , how_play suggests that respondents who score highly on this factor value the traditions and process of sports, a key characteristic of the old school mindset. This implies that Factor 4 may be indicative of how much an individual values the love of the game, as opposed to being primarily motivated by financial benefits.
Factor 5, consisting of only one variable, loyal, has a very high loading of 0.97, which strongly suggests that this factor represents the concept of loyalty to team members.
Factor 6, consisting of only the variable argues, has a moderate loading of 0.598. I assume argues represents the respondent’s tendency to argue with teammates. Furthermore, the lower factor loading implies that Factor 6 contributes less than the other factors to the overall model. Moreover, Factor 6 could be excluded from the analysis.
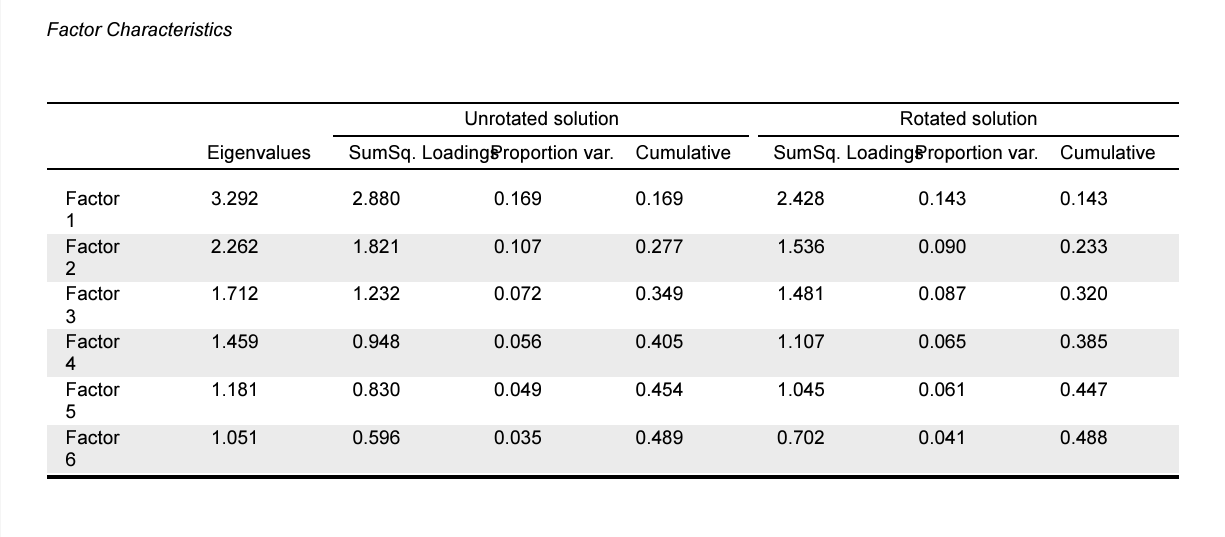
I analyzed the Factor Characteristics table to determine how much variance each factor explains. Factor 1 explains the most variance in the model with the highest Eigenvalue of the six factors, which is 3.292. Its proportion of variance explained is 0.143 (14.3%). Factor 2 has the second highest variance explained with an Eigenvalue of 2.262 and a proportion of variance explained of 9%. Factor 3, Factor 4, Factor 5, and Factor 6 have a proportion of variance explained of 8.7%, 6.5%, 6.1% and 4.1% respectively.