Sales Analysis Project
View this Dashboard on Tableau Public
Overview of the Dataset
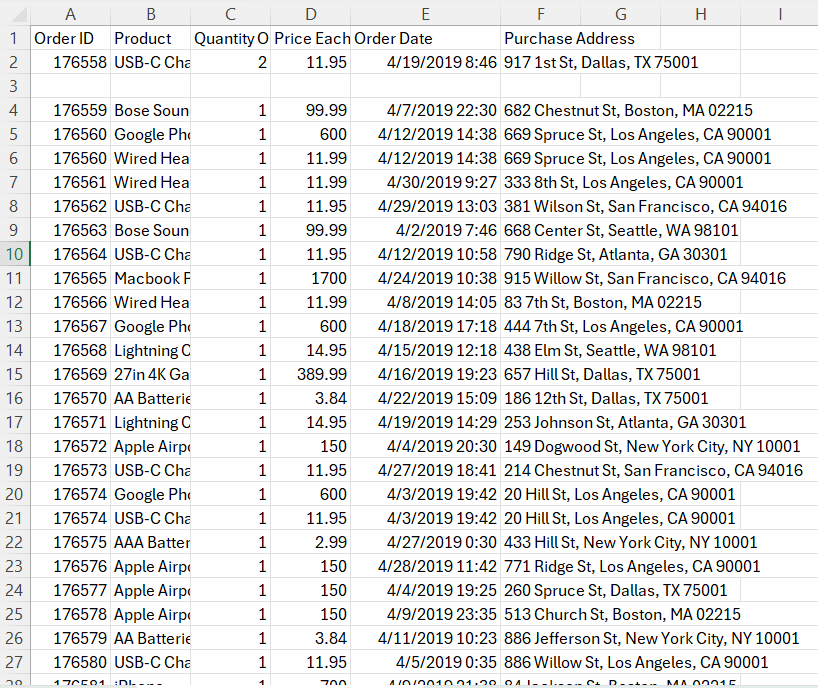
The dataset analyzed in this project consists of order data collected by an electronic goods retailer. There is one table included in this dataset, containing the following fields: Order ID, Product, Quantity Ordered, Price Each, Order Date, and Purchase Address.
The timeline of the data is one year (January 1, 2019 - January 1, 2020).
There were 19 different products sold by America’s Electronic Goods.
Customers have placed orders from 7 states in the U.S.
Data Cleaning
One of my primary goals for this project was to practice cleaning “dirty” data in Excel. I scoured Kaggle looking for a raw dataset, so that I could put the data cleaning techniques I learned through the Google Data Analytics courses to “real” use. Through working with this dataset, I’ve gained practical data analysis skills that will become handy in my future analyst role.
Sample of the Raw Data
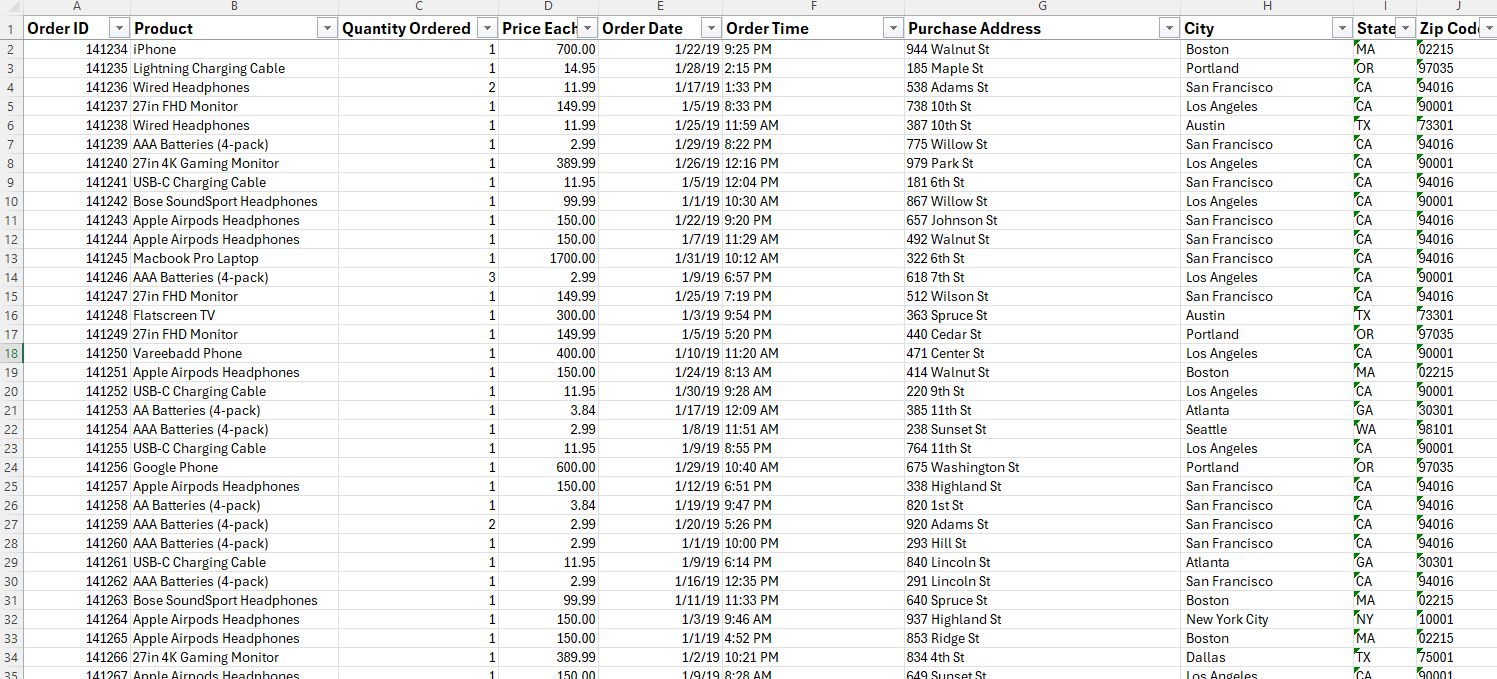
Sample of the Cleaned Data
Data Cleaning Performed:
Removed duplicate rows containing the same combination of Order ID, Product, Quantity Ordered, and Price Each, so there would be no duplicated product records for a single order.
Removed empty rows.
Sorted table by Order ID.
Converted Price Each, Order ID and Quantity Ordered from General to Number data type.
Split the Order Date column to separate the date and time.
Split the Purchase Address field into 3 columns: City, State, and Zip Code.
Removed the spaces before the States.
Descriptive Analysis Findings
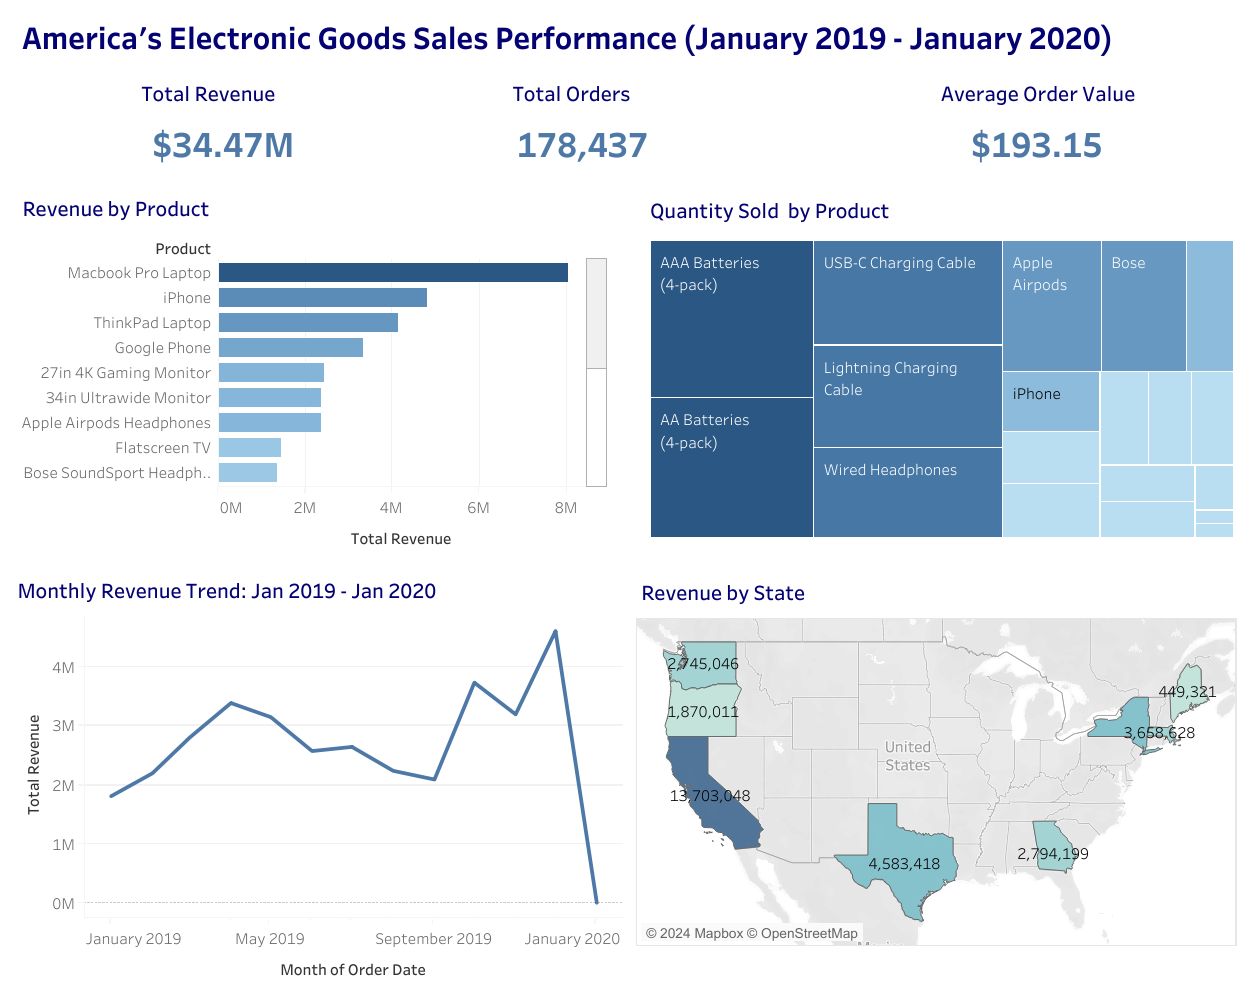
America’s Electronic Goods earned a total of $34,465,538 in sales revenue within the 1-year timespan from January 2019 – January 2020.
Of the 8 states included in the analysis, the highest revenue was obtained from customers in California, which was 39.76% of Total Revenue.
The MacBook Pro Laptop generated the highest Total Revenue of the 19 product offerings with a contribution of 23.31% of Total Revenue. The iPhone was the second highest performer, providing 13.91% of Total Revenue.
AAA and AA batteries reported the highest unit sales among all products. Despite this, they generated the lowest sales revenue.
Apple products contributed almost twice the revenue of competing brands in the same product categories, such as ThinkPad, Bose, and Google in the laptop, headphone, and cell phone categories, respectively.
Overall, there was sales growth during the year with significant peaks in April, October, and December. However, sales dropped below $3 Million from June to September. In December, sales were the highest, which was most likely due to the holiday shopping season.
Recommendations
Evaluate COGS of the MacBook Pro Laptop and iPhone to measure profitability. If the MacBook Pro and iPhone prove to be profitable products, focus on increasing unit sells. Consider offering financing options for Apple products to eliminate purchase barriers for price-conscious customers.
Implement target marketing campaigns towards the most profitable customers in California, Texas, and New York.
Bundle Apple products (ex. iPhone + Airpods, MacBook Pro + Airpods, and Macbook Pro + iPhone) during the holiday shopping season at a slight discount if feasible.